theft-pic
Stealing in San Francisco
Ever wondered what's really happening on the streets of San Francisco? Dive into our visualized analysis of reported thefts.

Intro

We are about to dive into a dataset of criminal activity in San Francisco, published by the San Francisco Police Department (SFPD). The dataset is limited to activities between 2003 and the first part of 2018. The activities are still being recorded, but the datasets from 2018 and onward are of a different format, hence we stick to the “older” data on purpose.

To avoid any confusions, we omit data from 2018, as data collection of this year is not complete.

Each entry of the dataset is a “criminal activity”, which is defined by an arrest. The dataset includes attributes like crime-type, date, time-of-date, location, and more.

Problem

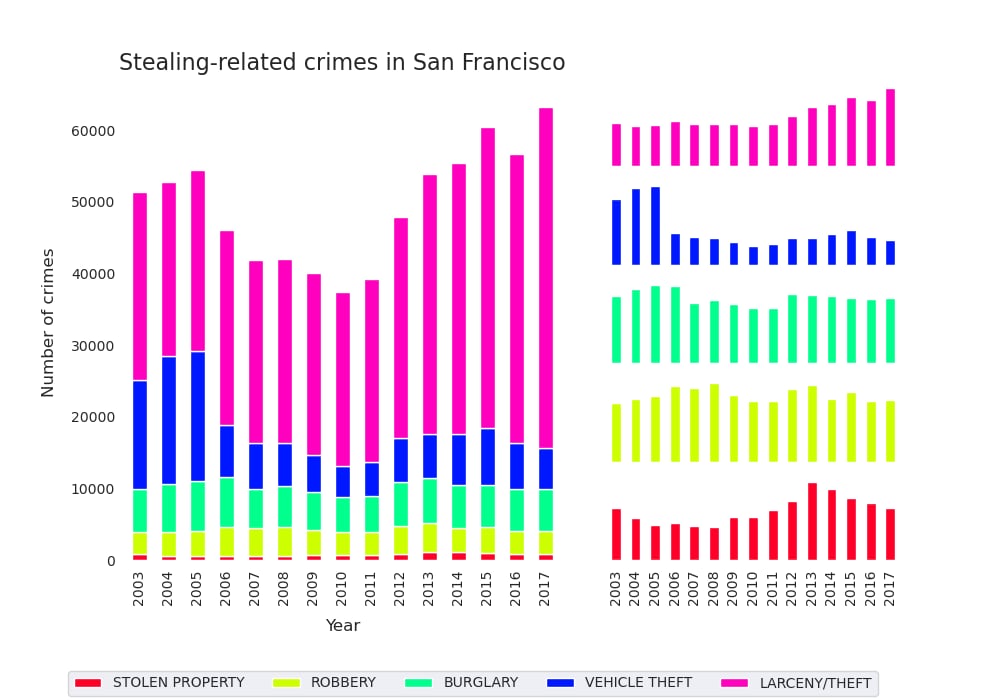
We would like to investigate the issue of stealing in San Francisco. Therefore, the following specific types of stealing will be the focus of the analysis.

  • Stolen Property: Taking someone else's belongings without permission with the intent to keep them.
  • Robbery: Stealing from someone using force or threat of force.
  • Burglary: Illegally entering a building to commit a crime, often theft.
  • Vehicle Theft: Taking someone else's vehicle without permission.
  • Larceny/Theft: Illegally taking someone else's property with no confrontation involved.

These crimes are likely correlated, and the aim is to determine existing trends.

Distribution of crimes


The first plot shows the overall distribution of each type of stealing-related crime. Amongst these, ‘Larceny/Theft’’ is most common. Crime types like ‘Stolen property’ are less common, and it is therefore hard to visually assess the development over time. The remaining plots show the normalized distribution of each crime type. These make it easier to understand the changes from year to year.

roundicons

We can immediate spot some interesting trends:

Larceny/theft is rather stable until 2012 where it increases somewhat linearly. This could suggest that there has been a change in legislation that introduces some slightly increasing incentive to commit more larceny. It could also be the result of an increase in the type of population that commits these crimes. One of the biggest events in 2012 would be the election of Barack Obama as president of the United States. It is not unreasonable that some of his policies might have had a butterfly effect that could impact the larceny statistics. But this pattern is only correlated, and not necessarily causality.

Burglary and robbery both seem to follow the same pattern. This suggests that the crimes are very correlated. They could be committed by the same people, or they could both even be the effect of some events. They both share the feature that they are both very fast ways to get money, even if robbery is usually punished more severely. We can imagine that at times of more poverty, people tend to commit crimes spontaneously in order to be able to pay the bills.

The number of vehicle thefts also changed very suddenly between 2005 and 2006. This is either the result of good law enforcement and law regulations, or it could be a change in administration. Maybe, some crimes formerly known as “vehicle theft” are being categorized into something new. We can see an increase in robbery in the following years. This could suggest that vehicle theft is also considered robbery (a.k.a. “Carjacking”) would now be considered a robbery.

When it comes to the “Stolen property” category, there seems to be a cyclical pattern, but also very few occurrences. This crime category is also not specified that well, as stealing of any sorts could be considered stealing property.

Crime-density by district


It can be challenging to detect trends in an area and determine whether they are correlated. Some areas may be more at risk of theft than others. This information could be useful for distributing police cars effectively.

When analyzing districts, one must consider normalizing the data to get a clearer picture of the situation. It is not necessarily true that the largest district receives the most reports of theft, so we must consider external factors such as population size or area. The latter can be easily applied.

The figure shows that Tenderloin has the highest density of crimes related to theft. This could mean that there is a trend of theft in that specific district, due to the significant difference between Tenderloin and the other districts' scores. The reasoning for this showing could be due to vulnerable communities or ghettos within the district. This analysis could therefore be a useful tool for police officers to prioritize patrols, allocate resources, and implement targeted crime prevention strategies in areas with higher theft densities, ultimately enhancing community safety and security.

We can also see that as we traverse away from the downtown district (Tenderloin), stealing crime tends to decrease. We can assume that most crime in general is most dense downtown, as they are in many cities. There could be many reasons for this; there are more things to steal, and it is more chaotic and crowded.

Daily crime activites


We want to take a look at the time-serie of the number of reports for each of our focus crimes. The following plot lets us focus on tighter time intervals, which lets us see activities that are hidden when only looking at the yearly summaries. Feel free to interact with the scroll-bar to travel through the time.

Bokeh Plot

Throughout all periods, the incidence of stolen properties remains consistently low. However, robbery, burglary, and vehicle theft were more prevalent until 2006, after which there was a significant decrease in reported cases of these crimes. In contrast, the number of larceny/theft reports fluctuated throughout the entire period, with peaks and troughs observed. Notably, multiple outliers are evident, indicating dates with abnormal activities.

For instance, an outlier in June 2017 shows approximately 50 more larceny-related crimes, while an outlier from December 2015 shows 50 fewer reports than expected for that period. These outliers may stem from special occasions such as elections, tax seasons, raids, or other events that impact the criminal system.

The plot does not directly indicate a significant correlation between Larceny/theft and the other crime type.


We have now discovered some interesting trends among the stealing crimes. Stealing tends to happen closer to the city center, different types of stealing have different behavior - also throughout the years, and some single days have an unusual amount of larceny-type theft.

In summary, there are many patterns to discover, but truly understanding the cause of each will require more expert knowledge.

comments powered by Disqus